A more recent replication (version 2.1.0) changes the scales of Abelson’s and Bernstein’s most important instance variables of citizens — “interest in the issue” (horizontal) and “attitude position” (vertical) — from variables initialised with a random uniform distribution between 0 and 1 to those initialised with a normal distribution with mean 0 and variance 1. The results of some of these runs can be viewed on this page.
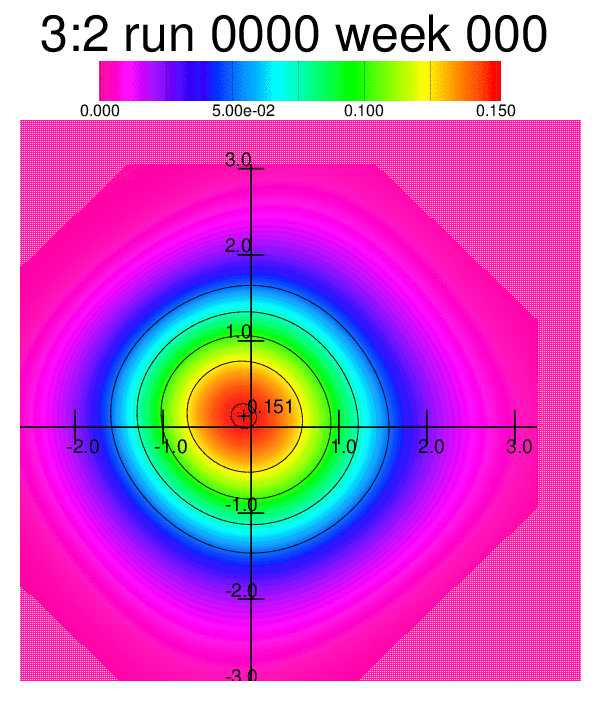
The two animations below of changing frequency distributions during a run of the model with two sources whose attitudes were +1.5 and -1.5, respectively, show (left) the joint distribution of the interest-in-the-issue (horizontal) and attitude-position (vertical) of 500 citizens and (right) the joint distribution of citizens’ attitude toward source 1 (horizontal) and toward source 2 (vertical).
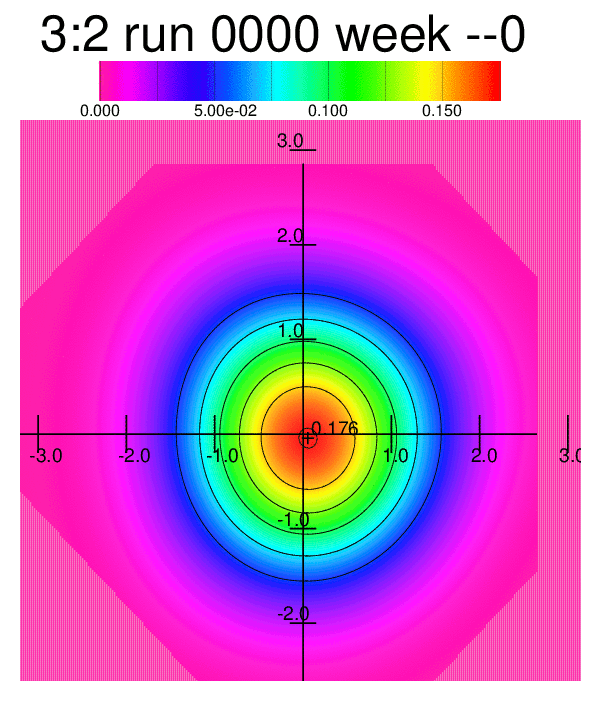
The mode of the interest-in-the-issue moves from about 0 to about 1, its standard deviation decreases, the tail to the left becomes longer, the tail to the right becomes steeper — whereas mode and mean of the attitude-position (towards the issue) remain, but the standard deviation increases.
The joint distribution of citizens’ attitude toward source 1 (horizontal) and toward source 2 (vertical)soon becomes bimodal, with a high mode meaning quite low sympathy with source 1 and moderately low sympathy with source 2 — and a lower mode with high sympathy for both sources at the same time. Citizens (in the top left quadrant) with high sympathy for source 2 and low sympathy for source 1 are quite frequent, citizens with the opposite combination are rather rare (the bottom right quadrant is nearly empty).
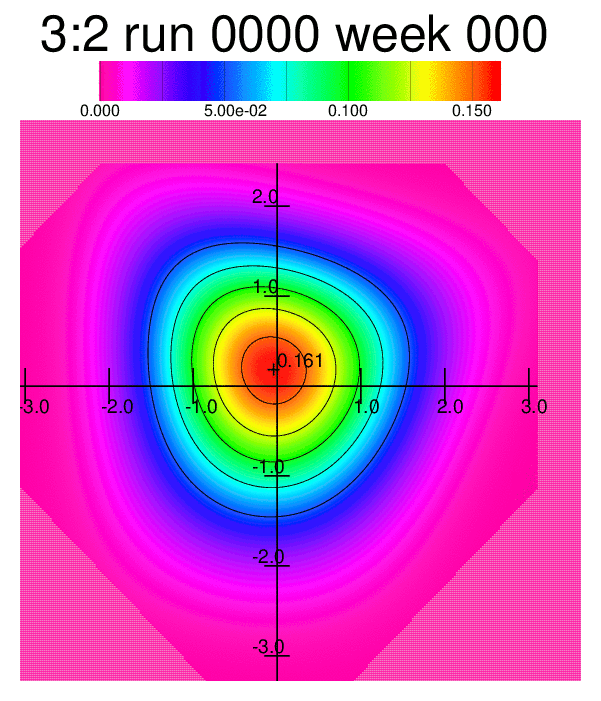
Another run with more moderate sources (+0.77 and -0.93) yielded the following results:
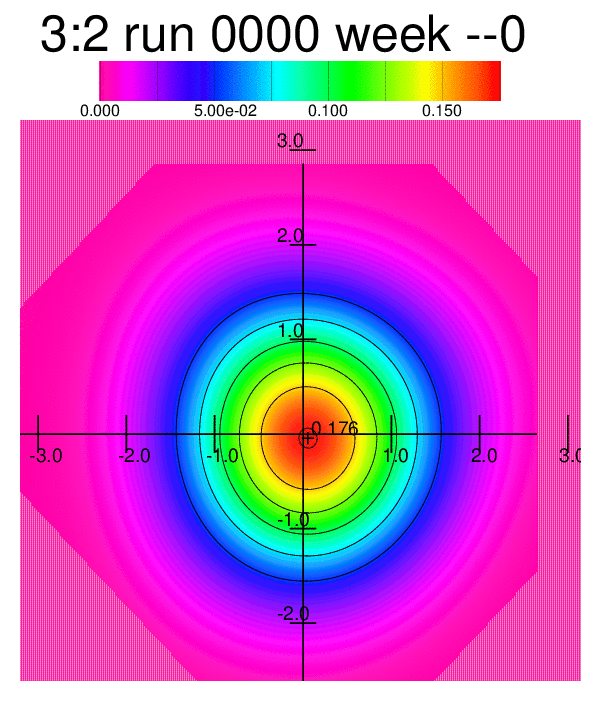
The mode of the interest-in-the-issue moves from about 0 to about 1, its standard deviation decreases, the tail to the left becomes longer, the tail to the right becomes steeper — whereas mode and mean of the attitude-position (towards the issue) remain, but the standard deviation increases — no great difference to the first example
The joint distribution of citizens’ attitude toward source 1 (horizontal) and toward source 2 (vertical)first moves its unique mode to the top left quadrant — meaning quite low sympathy with source 1 and quite high sympathy with source 2 — but from week 15 becomes trimodal, with the former high mode decreasing and two new modes, one with high sympathy for both sources — increasing from week 11 — and another with low sympathy for both sources — increasing from week 15. Citizens (in the top left quadrant) with high sympathy for source 2 and low sympathy for source 1 become less frequent such that the two modes in the upper right and lower left quadrants remain, citizens with the opposite combination are rather rare (the bottom right quadrant is nearly empty). In the end, the mode in the upper left corner has ceased to exist.
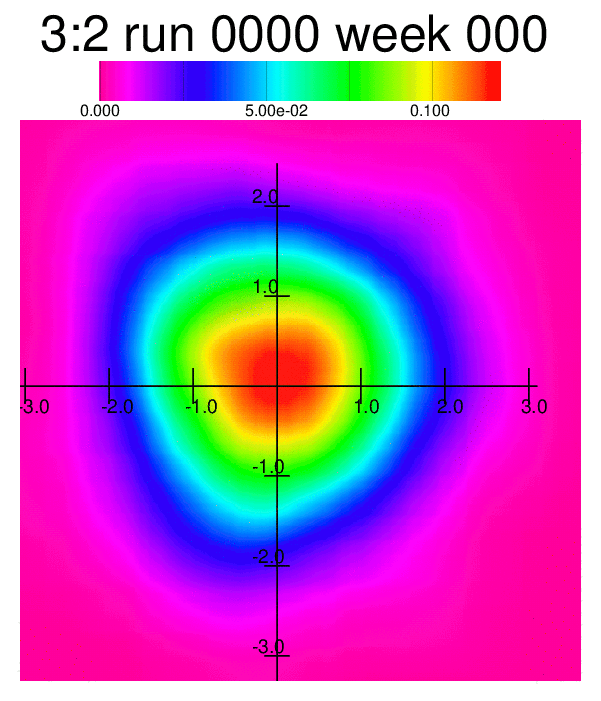
Whereas the animations above were processed with an algorithm approximating the simulated frequency distribution to a frequency distribution of the type exp(P(x,y;θ)) where P(x,y;θ) is a polynomial up to fourth degree, an animated heatmap shows more or less the same behaviour of the changing distribution:
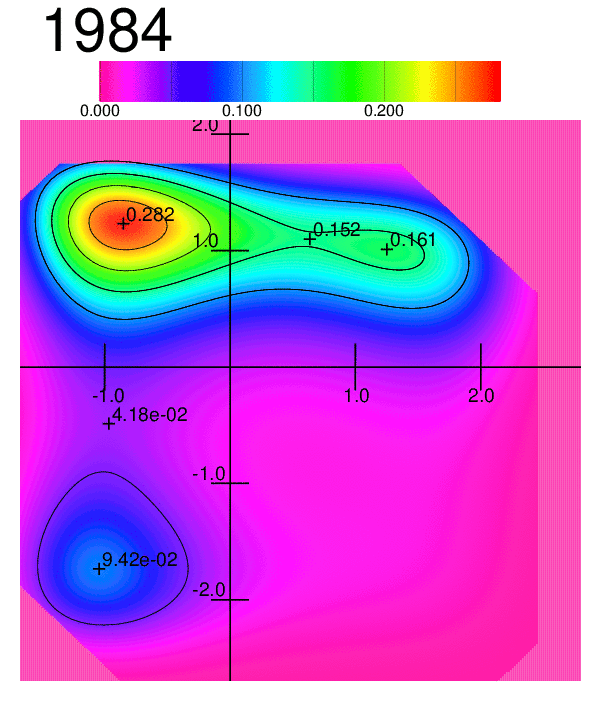
Similar distributions could be seen in empirical joint distributions of materialism (horizontal) and postmaterialism (vertical) in surveys of the German Socio-Economic Panel (SOEP 1984–2016). Details can be found in this publication.
Back to main entry
